ICYMI: Brands are flocking to Instagram. And, they’re seeing engagement rates that are through the roof–especially compared to other brands.
But, as a brand, how do you measure progress on Instagram? What tools are available?
Here’s one that provides a nice snapshot of data you can use (for free) in your marketing efforts: Iconosquare (formerly Statigram).
Great Instagram viewer, too. But, in terms of metrics and signals, it also gives you some numbers to pay attention to from month to month. Let’s take a peek.
The basics
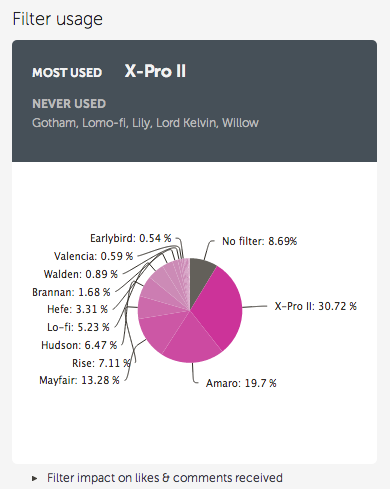
Iconosquare gives you a nice little snapshot of how often you posted in the last month, what you’re most used filter was (as you can see, I’m a big #amaro guy), and what tags you’re using most often. Not great bottom-line data here, but good indicators to review on a monthly basis just so you can track your brand account a bit.

Engagement
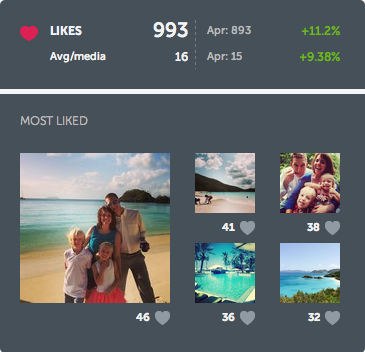
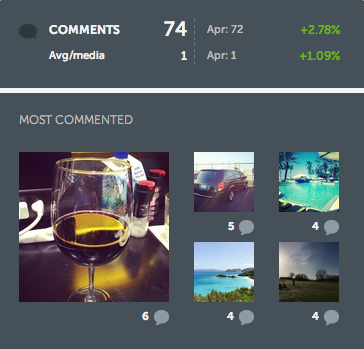
Here’s where we get into the meat-and-potatoes. Easily scan how many likes and comments you had for the previous month. Then, see how that relates to the previous month. I also love being able to scan and see what your most popular posts were in the last month, in terms of likes and comments.
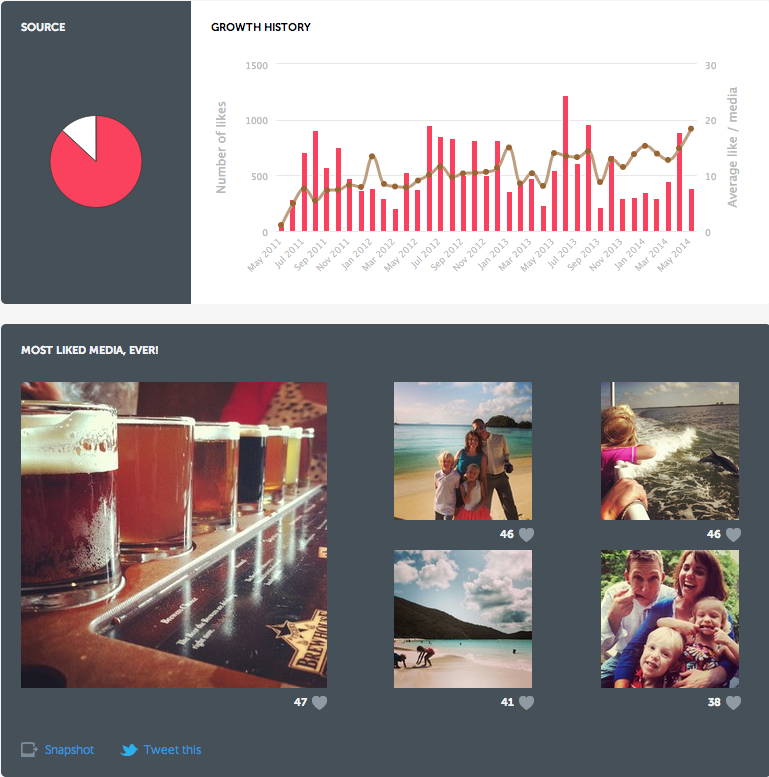
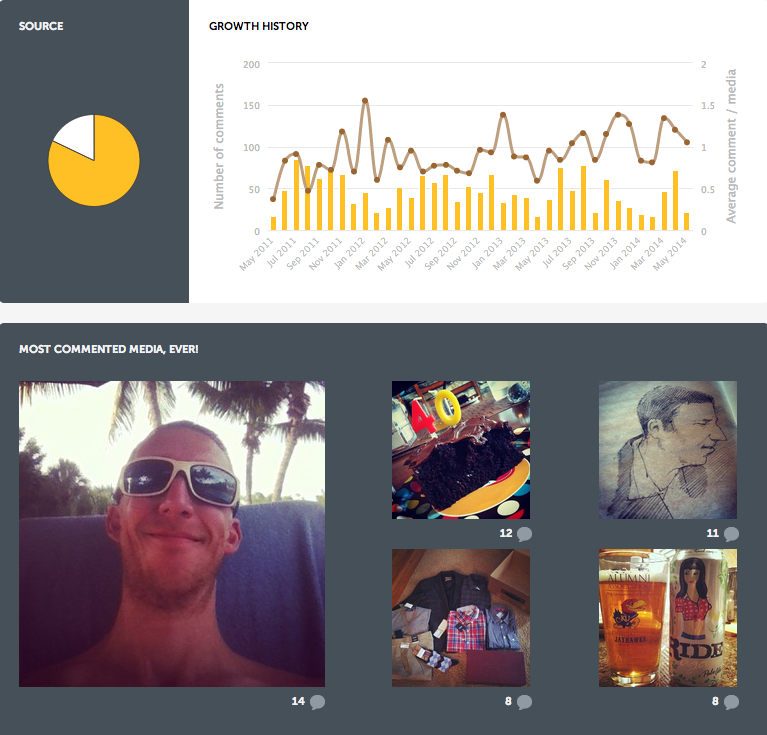
I also love these charts that show number of likes and comments by month over the year. Great way to track where you’re seeing the most engagement from month-to-month (bonus: screen-grabs of the visual charts work nicely for client reports!).
You can also view your most liked/commented posts of all time here–again, not great metrics, but good way to review and determine what kinds of posts/visuals are really resonating with fans (in my case, personally, my biggest months are always vacation months since that’s when I take and share the bulk of my pics).
Optimization
Looking to build a bigger base on IG? One strategy: Use this helpful chart to track the tags you’re currently using vs. the top tags on IG. As you can see, it shows you which tags you’re currently using that are in line with the big list–but then also shows you the big list of top tags on Instagram you potentially could be using to loop in new fans/followers.

Content
I’m not sure I find the primary content charts all that helpful in Iconosquare. For example, this “Filter Usage” graphic, which tells you which filters you use more than others, has minimal value on the brand side.
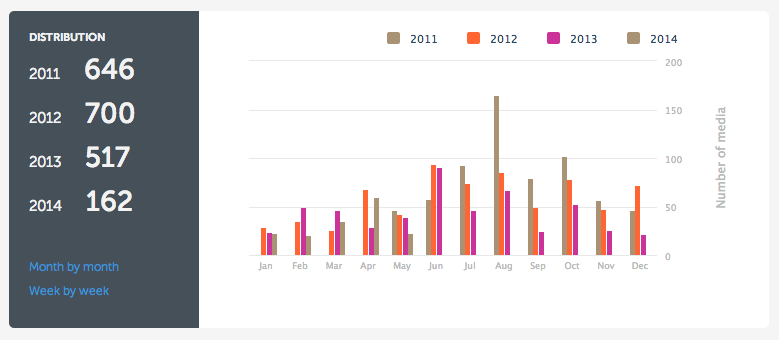
Likewise, this chart that shows the number of posts you’ve made by year, month or week isn’t all that helpful. Nice to look back at for end of month/year purposes, but overall, not all that helpful.
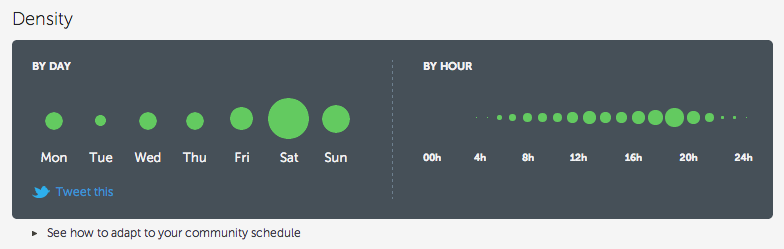
Or, this chart that shows when you typically post during the day–or by the hour.
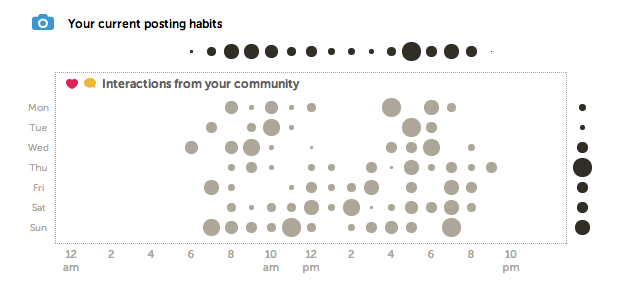
BUT, a couple other charts within this pane on Iconosquare ARE quite helpful. This chart pairs up the time of day you typically post compared with those in your community and when THEY post, outlining the best possible times to post with the largest gray circles. Now, THAT’S helpful information!
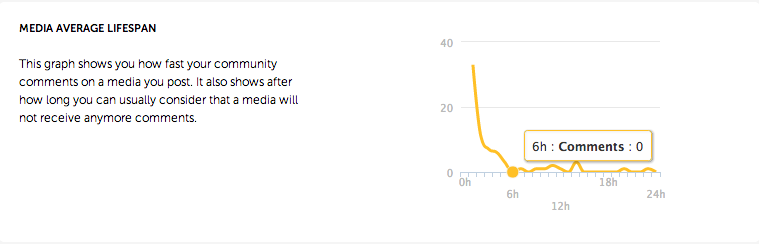
Or, this chart, which shows you how your comments dip as time elapses (most comments will typically happen in the first couple hours for me, personally).
So, overall, as you can see, you can learn quite a bit from the nice, free Iconosquare tool. Not the end-all-be-all when it comes to measuring Instagram success. But, for free, it’s not a bad place to start in terms of tracking progress and using data to make better decisions on Instagram down the road.

0 Comments